
Adding Error Bars to Plots
You can add error bars in the x and/or y directions to plots. Each point can have its own error bars and the bar lengths in the positive and negative directions can differ.
Column "Error Bars"
To add errors bars, add one to four special columns after the data set and make sure to select "Error Columns" in the "Error Bars / Statistics" section for customizing plot data. This selection plots "error bars" using data in the provided special columns as shown in the following figures:
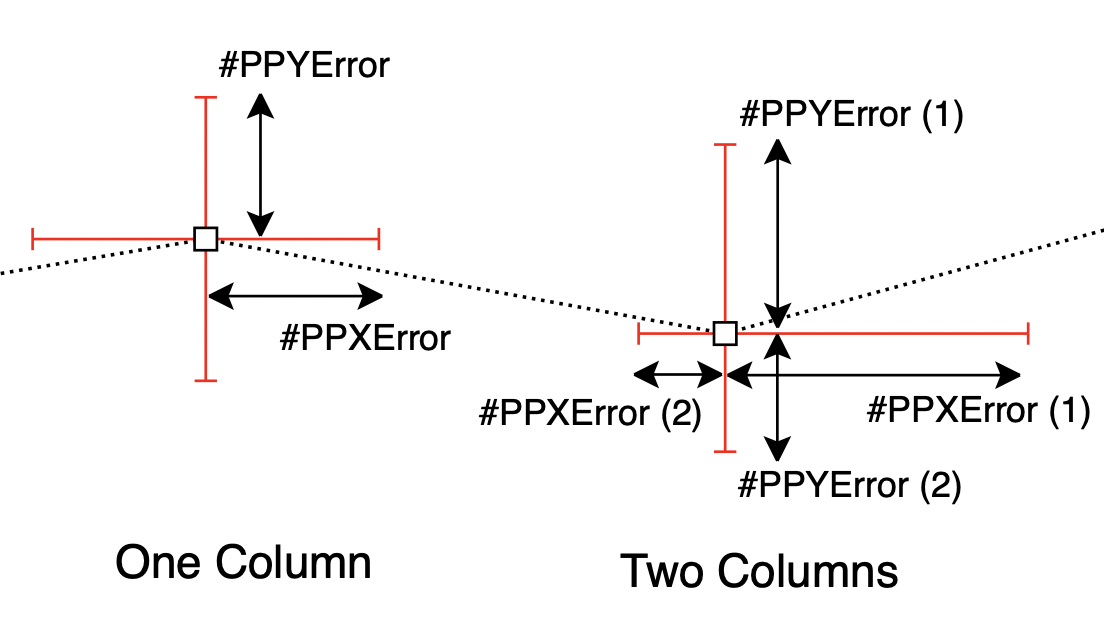
- To add error bars to plotted data from any column in a PublishPlot table, follow that column immediately by one or two columns labeled "#PPXError" and/or one or two columns labeled "#PPYError". The order does not matter.
- "#PPXError" columns will add horizontal error bars indicating uncertainty in the x value of the data point. "#PPYError" columns will add vertical error bars indicating uncertainty in the y value of the data point.
- The numbers in the "#PPXError" and "#PPYError" are magnitudes of the errors. Enter zero (or any negative number or blank entry in the table) to omit error bars on that point.
- If only one "#PPXError" or one "#PPYError" column is used, the error bars will draw in both the positive and minus directions and have the same magnitude given by the entry in the column (see "One Column" in above figure).
- If two "#PPXError" or two "#PPYError" columns are used, the first one gives the positive error (right side for x data or up side for y data) and the second gives the negative error (left side for x data to down side for y data), which is entered as a positive number (see "Two Columns" in above figure). Note that to omit error bar leg in one direction, you must use two columns and set one of them to 0 (or empty or a negative number).
- The error bars are the features in red in the above figures. You can customize their appearance (or hide them) using the methods for customizing plotted data sets. The plot values can be connected with optional plot lines and plot symbols (or can be hidden) by customizing those plotting features of your data set.
- Error bars are included in tables of data by adding their columns to the text. To correctly identify those columns as error bars, the table must include a "#setName" row with "#PPXError" or "#PPYError" for the error columns. If the table has other command lines (e.g., a "#setLineType" row), the entries for error bar columns are ignored. But, if the table includes additional data sets after one with error columns, the error bar column entries will need blank entries as space holders to align settings used for subsequent columns.
- It does not make sense to have error bars on labels used in bar charts. As a results, x errors are ignored and any "#PPXError" columns in a bar chart table are ignored.
Sample Error Bars in Columns
The following example is a table of data with error columns. To see error bars created by this example, copy and paste (or drag and drop) the text to a PublishPlot document.
#setColor        black
#setSymbolType   square
#setName         Data    #PPXError  #PPYError  #PPYError
0.5              1         0          0.5        0.3
1                2.6       0.25       0          0
2                1.3       0          0.2        0.8
3                2.4       0.5        0.2        0.2
4                3.6       0          1          0.4
5.5              4.5       0          0.2        3